 Reports allow users to select, preview, print or export:
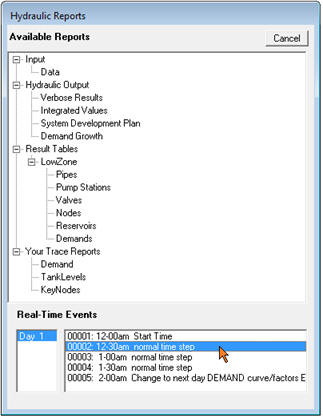
- input data values as a text report;
- hydraulic results as a text report;
- integrated values, maxima and minima during the simulated period;
- future assets to be developed in the system
and at what stage of development they are required;
- growth in the count of demand units in each demand area
(e.g. residential, commerce, industry) over time:
- a table of results for each type of component (e.g. pipes, tanks, valves)
at a selected time in the simulation;
- user-defined sets of time-based graphs. These allow users to group any hydraulic parameter from any component into a set of time-based graphs.